- About WIYN
- Observing at WIYN
Available Instruments
Optical Imaging
Infrared Imaging
Spectroscopy
Observing Tools
Observing Planning
At the Telescope
After Your Run
- Internal Use
WIYN Oversight
Calendars
WIYN SUPPLEMENTAL INFORMATION
WIYN Bent Cassegrain Port Interface
Folded Cass Port Interface Diagram
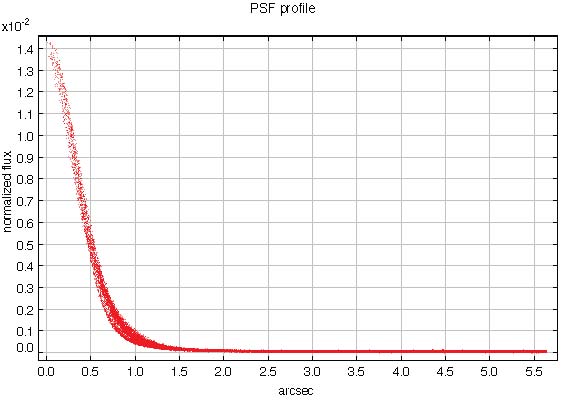
Below is a plot the PSFs of 15-16 r-mag stars in a pODI frame. An ASCII file containing a listing of the PSFs of various stars is also available. Please see the README file for more information.

3-D CAD drawing of the potential EPDS location (.step file)
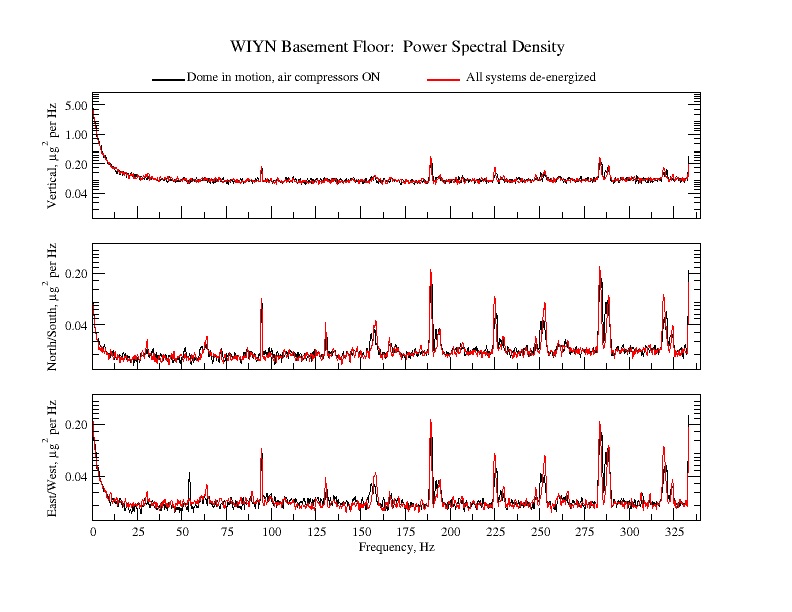
Below is a plot and data files for vibration spectrum measured (on the floor, cyan area) for the possible location of the EPDS. The data were reduced using standard power spectral density estimation techniques. The accelerometer was attached to the floor and has a 3dB cutoff of 500 Hz. The black trace is with the dome and air compressor activated, running. The red trace is with nothing energized. The units are in Hz for frequency and g for acceleration in the raw data files.

Data files: Dome and Air Compressor running, All systems off


Last modified: 03-Apr-2020 10:26:47 MST
- Observing at WIYN